

Technical Column
White Noise vs Pink Noise vs Sweep Signals
Jul 28, 2026
- HBK × SONORA Acoustic Measurement Solution Official Website
- Technical Column
- White Noise vs Pink Noise vs Sweep Signals
Acoustic Power Measurement
Article Summary
The “hiss” played through a loudspeaker during acoustic testing is not equipment noise. It is a deliberately selected test signal. White noise and pink noise differ in what “flat” means, while a swept-sine signal moves through the test frequency range and can be used to derive an impulse response. This article explains their characteristics, their practical use in standards-based testing, and the differences between swept-sine, ESS, and TSP signals from the perspective of Moritani Shokai.
What Is the “Hiss” During Acoustic Testing? White Noise, Pink Noise, and Sweep Signals Explained
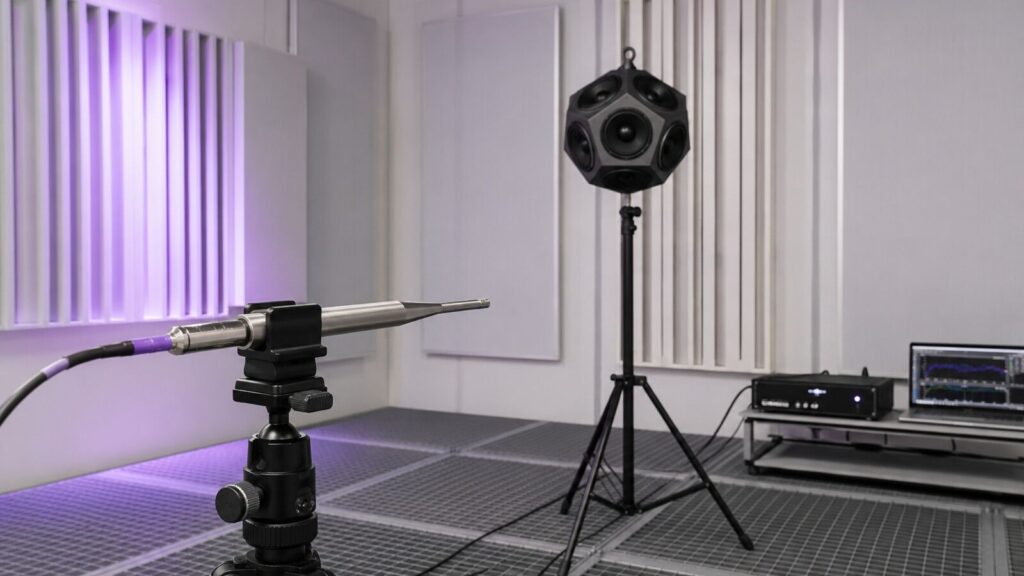
On the day of an acoustic test, the microphones are positioned, the test-room door is closed, and the system is made ready. Then a loudspeaker fills the room with a steady “hiss.”
To someone attending a test for the first time, it may sound like television static, rushing water, or a fault in the equipment. It is not a malfunction. The sound is a deliberately generated test signal.
Not every hiss is the same. White noise and pink noise distribute acoustic energy differently across frequency. A sweep signal—the rising tone that moves smoothly from low to high frequencies—uses a different principle to characterize a room, loudspeaker, or other system.
The important question is not which signal is best. It is which signal is appropriate for the quantity being measured.
| Signal | Defining characteristic | Typical audible impression | Common applications | Important limitation |
|---|---|---|---|---|
| White noise | Equal power in equal linear-frequency bandwidths, such as each 1 Hz interval | Bright, sharp “shhh” | FFT analysis, equipment checks, broadband excitation | A real generator and loudspeaker produce it only over a finite bandwidth |
| Pink noise | Equal power per octave | Fuller at low frequencies and softer than white noise | Octave-band analysis, system alignment, sound-insulation and room-acoustic tests | It is not shaped to an equal-loudness contour |
| Swept sine | The frequency of a sine wave changes with time | A tone that rises from low to high frequency | Impulse response, frequency response, reverberation time | TSP and ESS are related techniques, but the terms are not interchangeable |
What Is White Noise? Flat When Viewed in Equal-Hertz Bands
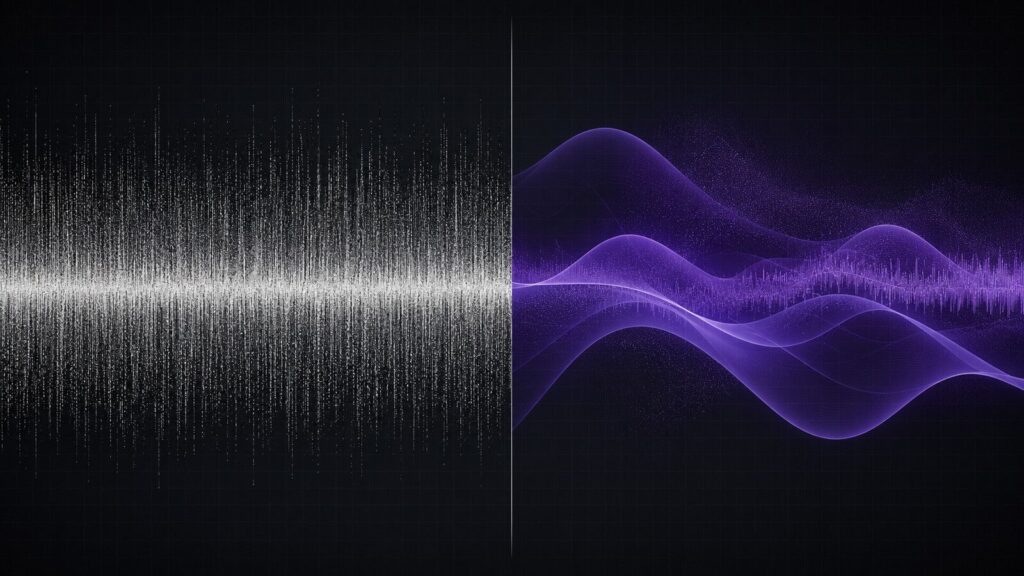
In the ideal definition, white noise is a random signal with a constant power spectral density per unit bandwidth.
Put more simply, if the spectrum is divided into equal 1 Hz intervals, each interval contains the same average power. When the signal is analyzed by an FFT with equal-width frequency bins and sufficient averaging, the spectrum appears flat.
White noise is often described as containing “all frequencies equally.” This is a useful shorthand, but it describes an ideal mathematical model. Real signal generators, amplifiers, and loudspeakers have finite operating bandwidths. In practice, white noise is generated and reproduced only over the frequency range required for the test.
The name is an analogy with white light. Just as white light contains a broad range of visible wavelengths, white noise contains a broad range of acoustic frequencies.
Why Does White Noise Sound Bright?
White noise has equal power per hertz, but octave bands become wider as frequency increases.
The band from 100 to 200 Hz is 100 Hz wide. The band from 1,000 to 2,000 Hz is 1,000 Hz wide. If every 1 Hz interval contains the same power, the second octave contains ten times as many intervals—and therefore more total power.
For this reason, the octave-band level of ideal white noise rises by approximately 3 dB for every octave increase in frequency. This is also why white noise often sounds bright or high-frequency-heavy.
What Is Pink Noise? Flat When Viewed in Octaves
Pink noise is a random signal designed so that each octave contains the same total power.
Because an octave doubles in bandwidth as frequency increases, the power per hertz must decrease toward higher frequencies. In the ideal case, the power spectral density is inversely proportional to frequency, which is why pink noise is also known as 1/f noise.
Expressed another way, its power spectral density falls by approximately 3 dB per octave, while the total power in each complete octave remains approximately equal.
Pink Noise Is Not “Matched to Human Hearing”
Pink noise is sometimes described as noise that has been adjusted to suit the human ear. That wording is misleading.
Human auditory sensitivity depends on both frequency and sound pressure level. Equal-loudness contours are not simple 1/f curves. Pink noise is therefore not a signal in which every frequency is perceived as equally loud.
Pink noise is useful in acoustics because frequency is commonly analyzed in logarithmic bands, particularly octave and one-third-octave bands. Since pink noise provides approximately equal energy to each octave, it can excite those bands simultaneously and is widely used for system alignment, room-acoustic testing, and sound-insulation measurements.
In a standards-based test, however, the name of the signal is not the only consideration. The source must provide adequate level in every required band, sufficient signal-to-noise ratio relative to background noise, and any band-to-band level distribution required by the applicable standard.
For more information about the influence of ambient sound on a test, see What Is Background Noise?.
Are Rain and Waterfalls Examples of Pink Noise?
Some natural sounds can exhibit 1/f-like behavior over a limited frequency range, which is why rain or waterfalls are sometimes compared with pink noise.
Actual natural sounds vary with weather, flow rate, distance, reflections, and recording conditions. They should not automatically be treated as ideal pink noise. Whether the result sounds comfortable is also subjective and depends on level, bandwidth, and the listener.
What Is a Sweep Signal? Testing Frequencies in Sequence
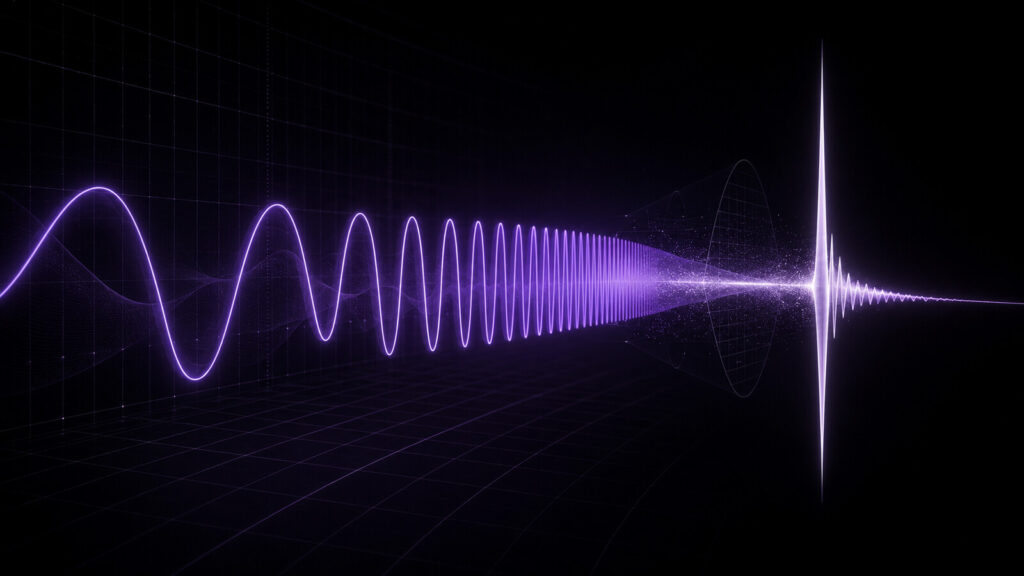
Instead of a steady hiss, an acoustic test may use a tone that rises smoothly from low to high frequency. This is commonly called a swept sine or sine sweep.
It is a sine wave whose frequency changes continuously with time. A linear sweep changes at a constant number of hertz per second. A logarithmic or exponential sweep changes at a constant frequency ratio, often described by a fixed time per octave.
Noise signals excite many frequencies at the same time. An ideal swept sine concentrates its energy within a narrow frequency region at each instant. By exciting the required frequency range over time, recording the response, and applying an inverse filter or deconvolution process, the system’s impulse response can be obtained.
An impulse response describes how a room or device reacts to a short excitation. It can be thought of as an acoustic fingerprint. With the appropriate processing, it can reveal frequency response, arrival times of reflections, and reverberant decay.
The related concept of measuring the transmission path from a source to a receiver is discussed in Source Contribution Analysis and Acoustic Transfer Function Measurement.
Why Swept-Sine Measurements Can Achieve a High Signal-to-Noise Ratio
The benefit of a swept sine is not simply that it plays one frequency at a time. The measurement can deliver substantial total energy over the duration of the sweep, and the known excitation signal can be used to extract the response after recording.
If the test environment and device remain stable, increasing the sweep duration can improve the effective signal-to-noise ratio and lower the resulting noise floor. With an exponential sine sweep and suitable inverse filtering, harmonic distortion produced by a loudspeaker or other weakly nonlinear system can also be separated in time from the linear impulse response.
Longer is not always better. If a person moves during the sweep, a machine changes operating condition, or airflow varies significantly, the assumption of a time-invariant system is weakened. The sweep duration must be selected to suit both the required dynamic range and the stability of the test.
Swept Sine, ESS, and TSP Are Not Identical Terms
The terms “sweep” and “TSP” are sometimes used loosely for signals that sound similar. For technical documentation, they should be distinguished.
| Term | Meaning | Important note |
|---|---|---|
| Swept sine | General term for a sine wave whose frequency changes continuously | Includes linear, logarithmic, and exponential designs |
| ESS | Exponential Sine Sweep | Widely used for impulse-response measurements and can facilitate separation of harmonic distortion |
| TSP | Time-Stretched Pulse, a phase-designed signal that compresses into an impulse after inverse filtering | Some implementations sound sweep-like, but TSP is not another name for every sine sweep |
For a general explanation, “a test tone that moves from low to high frequency” may be sufficient. A formal test specification or report should identify the actual signal type, frequency range, duration, number of averages, and inverse-processing method.
Which Signals Are Used for Reverberation-Time Measurements?
Two broad approaches are commonly used to measure reverberation time.
1. Interrupted-Noise Method
Broadband or band-limited noise is played until the sound field reaches a steady condition. The source is then stopped, and reverberation time is derived from the subsequent sound-level decay.
Because random noise fluctuates, adequate excitation time and repeated measurements or averaging may be required. The decay must also have sufficient dynamic range above the background noise in each frequency band.
2. Integrated Impulse-Response Method
A known signal—such as a swept sine or maximum-length sequence—is reproduced and the impulse response is derived from the recorded result. The squared impulse response is then integrated in reverse time to obtain an energy-decay curve from which reverberation parameters can be calculated.
ISO 3382-1 and ISO 3382-2 address room-acoustic parameters and methods based on interrupted noise and integrated impulse responses. ISO 18233 provides additional requirements and guidance for newer measurement techniques, including swept-sine and maximum-length-sequence methods.
The Appropriate Signal Depends on the Measurement Objective
Different acoustic tests require different excitation strategies.
| Measurement or task | Common signals | Reason and caution |
|---|---|---|
| Level difference and airborne sound insulation | Broadband noise, pink noise, or another compliant source signal | Multiple bands can be excited simultaneously; source-room level, background-noise margin, and spatial uniformity must satisfy the applicable standard |
| Reverberation time and room acoustics | Interrupted noise, swept sine, or MLS | Select the interrupted-noise or impulse-response method to suit the room and objective |
| Sound power and product-noise evaluation | Normal DUT operating sound, steady test operation, and calibration or verification signals as required | Operating condition, measurement surface, microphone positions, background-noise correction, and test environment must be controlled as one system |
| Loudspeakers and electroacoustic devices | Pink noise or swept sine | Suitable for octave-band response, frequency response, distortion, and impulse-response testing |
| Equipment frequency response and FFT analysis | White noise or swept sine | Used for equal-Hz analysis or frequency-by-frequency response evaluation |
| High-dynamic-range impulse-response measurement | ESS, other swept-sine methods, TSP, or MLS | Response is extracted through deconvolution or correlation; nonlinearity, background noise, and time variance must be considered |
Selecting the signal alone does not complete the measurement. Loudspeaker directivity and output, source and microphone positions, test bandwidth, background noise, averaging time, DUT stability, and analysis settings must all be included in the test plan.
For precision work, the test room and instrumentation should not be treated as separate projects. See Why Measurement Rooms and Measurement Instruments Must Be Designed Together.
HBK Measurement Systems and Test Signals
In a complete measurement system, signal generation, calibrated sensing, data acquisition, frequency analysis, averaging, and standards-based calculations are designed as a single measurement chain.
In sound power testing, for example, playing a test signal is not the final objective. The device under test must operate under defined conditions, calibrated microphones must acquire data at the required positions, and the result must account for background noise and the acoustic performance of the test environment.
Moritani Shokai combines HBK acoustic and vibration instrumentation with Sonora Technology anechoic chambers, semi-anechoic chambers, and anechoic boxes. This makes it possible to consider the signal, sensor, analysis platform, and measurement environment as one integrated system.
For a practical example, see Precision Sound Power Measurements with ISO 3744 and HBK PULSE.
The Same Noise Signals Are Also Used in PA and Music Production
Pink noise is frequently used when aligning PA systems and loudspeakers. It is convenient for viewing one-third-octave or octave-band response because it excites all of those bands simultaneously.
In music production, one informal technique uses low-level pink noise as a reference while setting an initial balance between tracks. This is a creative starting point, not a standardized acoustical method, and it does not guarantee a good mix.
White noise is also used in synthesizers to create components of snare drums, hi-hats, and filtered transition effects. The same basic signal can therefore be both a measurement tool and a sound-design material.
Understanding the “Hiss” Changes How You See the Test
The difference between white noise and pink noise is not that one is truly flat and the other is not. They are flat on different frequency scales.
White noise is flat in equal linear-frequency bandwidths.
Pink noise is flat in equal octave bandwidths.
A swept sine moves through the frequency range in sequence and can be processed to derive an impulse response.
Each signal has applications for which it is particularly useful. The signal alone, however, does not determine measurement accuracy. A reliable result requires an appropriate method, adequate signal-to-noise ratio, compliant source and receiver positions, calibrated instrumentation, and a suitable acoustic environment.
Moritani Shokai provides integrated acoustic measurement systems combining HBK instrumentation and analysis platforms with Sonora Technology anechoic chambers, semi-anechoic chambers, and anechoic boxes.
If you would like to evaluate the test signal, microphones, acquisition and analysis system, and acoustic test environment together, please contact Moritani Shokai.
Frequently Asked Questions
Is Pink Noise Easier on the Ear Than White Noise?
Because pink noise contains less high-frequency power per hertz, it often sounds softer than white noise under comparable conditions. Perceived comfort still depends on playback level, bandwidth, loudspeaker response, and the listener. This does not mean that pink noise is safe to reproduce at high level or for an extended period.
Is Pink Noise Always Required for Sound-Insulation Testing?
No. The signal depends on the applicable standard and measurement objective. What matters is adequate level and signal-to-noise ratio in every required band, together with compliance with spatial and band-to-band source requirements.
Is a Sweep Signal the Same as a TSP Signal?
No. A sweep signal is a general term for a sine wave whose frequency changes continuously. TSP is a phase-designed signal that compresses into an impulse after inverse filtering. Some TSP implementations may sound sweep-like, but not every sweep is a TSP.
Can a Smartphone Noise App Be Used for a Formal Measurement?
A phone app may be useful for a simple demonstration or functional check, but it is not suitable for a standards-based measurement. The signal accuracy, output stage, amplifier, loudspeaker, microphone response, calibration, and level management would all need to be verified.
Why Are Noise Measurements Repeated?
White noise and pink noise are random signals. A short measurement therefore contains statistical variation. Longer measurement duration and repeated averages reduce this variation. The required duration and number of averages depend on the method and required uncertainty.
References
ISO 3382-1:2009, *Acoustics — Measurement of room acoustic parameters — Part 1: Performance spaces*
ISO 18233:2006, Acoustics — Application of new measurement methods in building and room acoustics
A. Farina, “Simultaneous Measurement of Impulse Response and Distortion with a Swept-Sine Technique,” 108th AES Convention, Convention Paper 5093, 2000.
Latest Posts in Technical Column
-
2026.07.28
White Noise vs Pink Noise vs Sweep Signals -
2026.07.13
Acoustic Adjustment with Soundproof Partitions ― Applications for Anechoic Chamber Tuning, Simplified Acoustic Measurements, and STI Environment Design ― -
2026.07.08
Why HBK × SONORA? ― The Benefits of Integrating Acoustic Instrumentation and Acoustic Test Environments ― -

2026.05.18
Misconceptions About a Sound Absorption Coefficient of 0.99 ― How ISO 3745:2012 Changed the Philosophy of Anechoic Room Evaluation ― -
2026.05.13
How to Use HATS ― Operating a Measurement System That Reproduces the Human Head and Ears Within the Framework of Standards and Acoustic Environments ― -
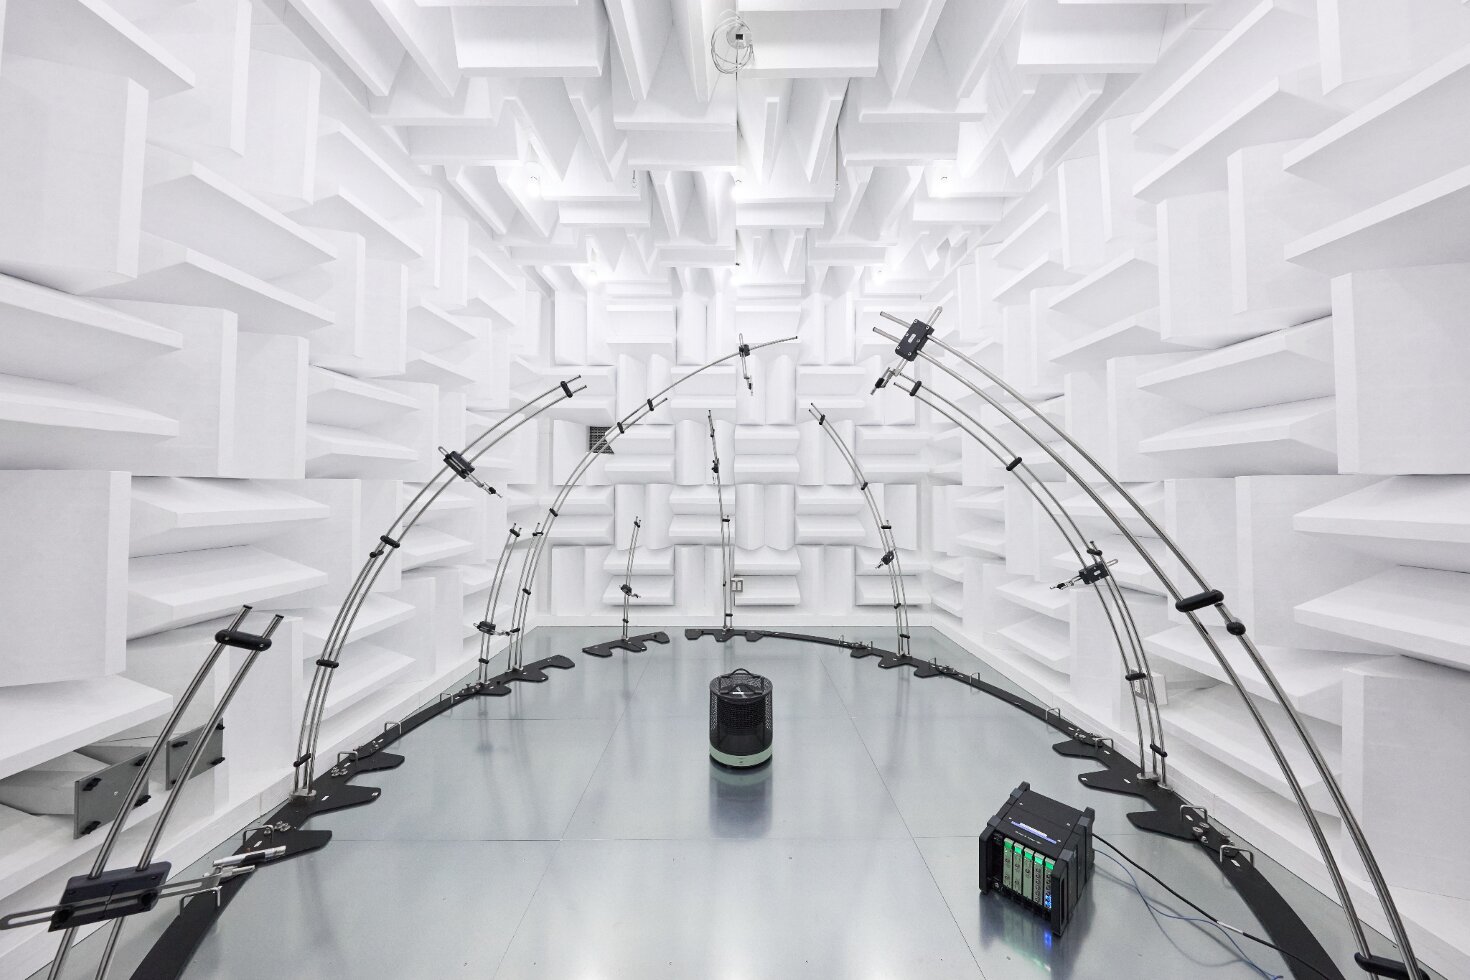
2026.04.13
Evaluation Methods in Building Acoustics: Streamlining Field Measurements and Material Assessment in Laboratory Environments -

2026.03.23
We participated in the corporate exhibition at the Acoustical Society of Japan (ASJ) Meeting on March 19, 2026 -
2026.03.10
How to Read Standards Related to Anechoic Chambers ― Organizing Sound Power Measurement Standards and Qualification of Test Environments ― -
2026.01.29
Can We Create “Absolute Silence” on Earth? — An Academic Reading of Anechoic Chambers and Ultra-Low Background-Noise Measurement — -
2025.12.11
The Geometry of Acoustic Design — How Chamber Shape Defines Sound Field Performance

Contact Us
- Contact us by email
-
- Contact us by phone
-
Moritani Shokai
(Machinery Department No. 2, Tokyo Head Office)


Introduction of the Manufacturer
-

Hottinger Bruel & Kjaer
HHBK is a merger of two companies: Brüel & Kjær of Denmark and HBM of Germany.
Brüel & Kjær is one of the world’s leading manufacturers of acoustic and vibration measurement instruments, known as a total measurement chain supplier.Learn more about HBK
-

Sonora Technology Co., Ltd.
Sonora Technology is a leading Japanese manufacturer of industrial anechoic chambers and anechoic boxes.
From design and manufacturing to installation and acoustic performance assurance, Sonora provides fully integrated solutions to build complete acoustic measurement environments from the ground up.Learn more about Sonora

Contact / Request Brochure
For inquiries or consultations regarding the total solutions provided by HBK × Sonora, please feel free to contact us using the Contact button.
If you would like a brochure sent by mail, please use the Request Brochure button.